Winter 2020
Safe Bet
Responsible lending brings stability to financial crises
By Jordan van Rijn 
The 2007 to 2009 financial crisis is widely considered to be the worst economic recession since the Great Depression. In total, an estimated 9 million workers lost their jobs and the unemployment rate rose to 10 percent, almost three times what it is today. Moreover, at its bottom, the stock market fell by 50 percent – causing many households to lose a significant amount of their retirement savings – and home values dropped by an estimated 33 percent, leaving more than 30 percent of homeowners “ underwater” and owing more than the value of their homes. Nearly 4 million foreclosures were recorded in 2009 alone – a 120 percent increase from 2007 – representing 2.21 percent of all US housing units
What caused the financial crisis? And what role did nonprofit financial cooperatives, or credit unions, play? The academic literature shows that the financial crisis was caused by numerous complex and interrelated factors, and blame has been assigned to various actors, including regulators, credit agencies, government housing policies, consumers, and financial institutions. However, almost everyone agrees that the main proximate causes of the crisis where the rise in subprime mortgage lending and the increase in housing speculation, which led to a housing bubble that eventually burst.
Banks – particularly big banks such as Chase, Wells Fargo, and Bank of America – were largely blamed for the crisis. In fact, an annual Gallup survey measuring confidence in American institutions shows that the percentage of people who had a “ great deal” or “ quite a lot” of confidence in banks fell from 53 percent in 2004 to just 21 percent in 2012, becoming one of the lowest-rated American institutions.2 This disdain for banks culminated in “ Bank Transfer Day,” a consumer-led initiative that called for a voluntary switch from commercial banks to non-for-profit credit unions, and led to hundreds of thousands of consumers joining credit unions in 2011 and 20123
Was this criticism of banks justified? Who exactly engaged in the subprime lending that helped fuel the crisis? The term “subprime” is not easily defined, but it is generally understood as characterizing particularly risky loans with interest rates that are well above market rates. These might include loans to borrowers who have a previous record of delinquency, low credit scores and/or a particularly high debt service-to-income ratio. Of course, not all subprime lending is “bad,” and many credit unions take pride in offering subprime loans to disadvantaged communities.
However, the particularly large rise in subprime lending that led to the financial crisis was certainly not this type of mission-driven subprime lending. Indeed, while banks may at times appear to serve low-income and underserved populations more than credit unions, the often-overlooked corollary to this fact is that loans to these populations are often predatory and may in fact cause more harm than good. For instance, evidence suggests that subprime mortgage boom prior to the financial crisis and subsequent foreclosure crisis created tremendous suffering for many households – particularly communities of color – including both financial costs ( for example, foreclosures and bankruptcies), as well as psychological costs (such as increased feelings of stress, anxiety and insecurity, and even suicides).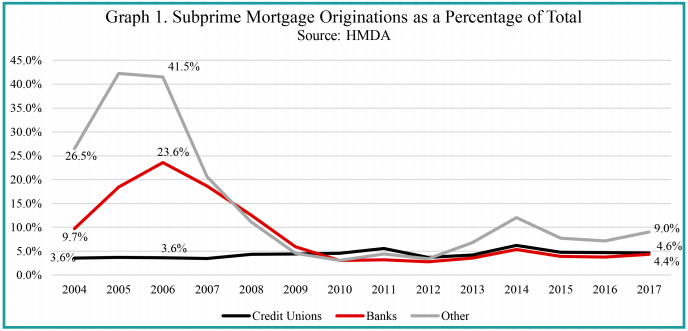
If we use the Home Mortgage Disclosure Act (HMDA) data and apply a commonly utilized measure to identify subprime mortgages as mortgages with interest rates that were more than 3 percentage points above the Treasury yield for a comparable maturity at the time of origination, we find that in 2006—immediately before the financial crisis— almost a third (28.7 percent) of all originated mortgages were “subprime,” up from just 15.1 percent in 2004. Graph 1 shows that at nondepository financial institutions—such as mortgage origination companies—an astounding 41.5 percent of all originated mortgages were subprime, up from 26.5 percent in 2004. At banks, 23.6 percent of originated mortgages were subprime in 2006, up from just 9.7 percent in 2004.
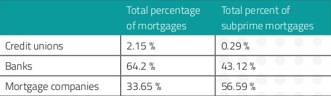
However, at credit unions, a mere 3.6 percent of originated mortgages could be classified as “subprime” in 2006, the exact same figure as in 2004. Overall, in absolute terms, from 2004 to 2006, while credit unions only originated 2.15 percent of total mortgages, they originated a minuscule 0.29 percent of all subprime mortgages. Banks, on the other hand, originated 64.2 percent of all mortgages and 43.12 percent of all subprime mortgages (while mortgage companies originated the remaining 56.59 percent of subprime mortgages). These are incredible statistics, since they indicate that while banks and mortgage companies significantly increased their subprime lending in the run-up to the financial crisis, credit unions did not increase their subprime lending at all, and overall appear to have had very little to do with the subprime mortgage crisis.
Subprime mortgage breakdown between 2004 and 2006
But we must be cautious in attributing these differences to the nonprofit cooperative structure of credit unions. In fact, there are many reasons that credit unions might not have engaged in the same amount of subprime mortgage lending as banks that have nothing to do with their structure. For instance, perhaps credit unions wanted to do more subprime lending but were just too small to have the resources to be able to reach “subprime” populations. Or maybe regulations prevented credit unions from offering particularly risky loans, whereas banks and mortgage companies had more regulatory freedom. Another possibility is that credit unions were simply unable to access the capital markets needed to fund a large increase in mortgage lending during the “boom” period just before the crisis.
Given all of these potential explanations, we developed an econometric model that attempts to account for alternative theories and controls for many important differences between credit unions and banks besides structure and incentives, including asset size, portfolio concentration, market share, earnings, liquidity, leverage, mortgages sold to the secondary market, core deposits, and state-level indicators of economic performance and housing prices.
Even after accounting for all these other differences between banks and credit unions, we still find that banks disbursed approximately five times the amount of subprime lending at credit unions. In other words, even when comparing credit unions to relatively similar “community banks” that are comparable in size to credit unions, have similar loan portfolios and access to capital markets, are geographically local, and are similarly regulated, these banks still engaged in significantly more subprime lending than credit unions.
What were some of the consequences of these disparate actions by credit unions and other financial institutions? Since many subprime mortgages were sold to the secondary market, it’s difficult to know the exact performance of mortgages originated at banks and mortgage companies versus credit unions. However, if we look at the performance of depository institutions during the peak of the financial crisis, we see that delinquency and charge-off ratios spiked at banks to 5.60 percent and 2.60 percent, respectively, in 2009, versus only 1.82 percent and 1.21 percent at credit unions. The difference in mortgage performance is even more stark—for mortgages that remained on the books of banks and credit unions, 7.25 percent of mortgages originated at banks were delinquent in 2009 (versus only 1.97 percent at credit unions), and 3.95 percent of bank mortgages were charged off (versus only 0.55 percent of credit union mortgages).
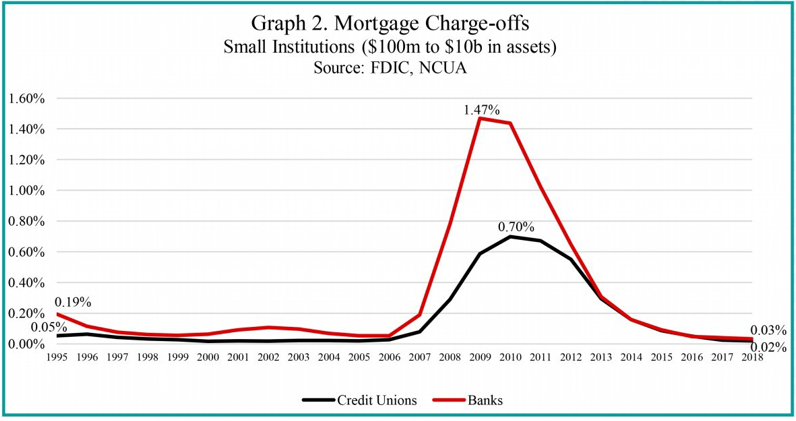
For instance, Graph 2 shows that even just looking at credit unions and small banks with between $100 million and $10 billion in assets (thus excluding many mid-sized and large banks that are not comparable to credit unions), we still find that banks had over twice the mortgage charge-off rate of credit unions. And that’s despite the fact that in 2007, 58.4 percent of bank mortgages were sold to the secondary market versus only 20.6 percent of credit union mortgages (so many of the bad subprime loans do not even show up in the charge-off statistics).
Moreover, the risky lending at commercial banks helped precipitate the failure of 331 banks between 2009 and 2011, while only 64 credit unions failed during that same period (despite roughly the same number of banks and credit unions). In fact, the bank’s share insurance fund (the Federal Deposit Insurance Corporation, or FDIC) became insolvent in both 2009 and 2010, while credit unions’ share insurance fund (the National Credit Union Administration, or NCUA) remained incredibly stable during that time, staying positive and falling only 6 percent between 2006 and 2009. The NCUA retained a strong balance of $1.23 per $100 in insured deposits, versus a negative – $0.39 per $100 in insured deposits at the FDIC.
Thus, via the Troubled Asset Relief Program (TARP), the government provided emergency loans to 710 banks totaling $236 billion—or 1.93 percent of all bank assets. On the other hand, a mere 48 credit unions received TARP funding for a total of just $70 million, or 0.008 percent of credit union assets. In other words, the government bailout largely went to for-profit banks, not credit unions.
Why did banks—even relatively small and local “community” banks—engage in so much more subprime lending compared to similarly-sized credit unions? We argue that the most likely explanation is that banks and credit unions differ in terms of structure and related incentives: due to their nonprofit cooperative structure—relative to the for-profit shareholder-owned structure of commercial banks—credit unions are relatively more incentivized to consider the long-term best interests of their members.
For example, in a previous article for the Cooperative Business Journal, I showed that the executive compensation structures of community banks are more closely aligned to performance relative to credit unions—23.3 percent of bank CEO compensation is variable and directly tied to performance versus only 7.2 percent of the compensation of CEOs at credit unions. Therefore, credit union CEOs have more flexibility and creativity to focus on customer service and long-term planning and mission, thereby creating a bulwark against excessive risk-taking and short-term planning that might harm their members’ best interests (such as risky subprime mortgage lending). Bank CEOs, on the other hand, are incentivized towards short-term profits from both their compensation structures and the demands of shareholders who expect a high return—particularly when the economy is booming like it was during the period just prior to the financial crisis.
These findings hold numerous policy implications for researchers, regulators and policymakers. For researchers and academics, the results imply that nonprofit and cooperative forms of governance generate discrete incentive structures relative to for-profit models. Moreover, these differences create substantively distinct outcomes for consumers, borrowers and households. Similar to credit unions, other nonprofit and cooperative firms—such as nonprofit hospitals or cooperative grocery stores—may better consider the long-term interests of their customers and members, and this should be considered when modeling the objective functions of alternative forms of organization and corporate governance.
It should also be kept in mind when policymakers consider how to tax and regulate nonprofits and cooperatives. For example, cooperative grocery stores may be more likely to closely consider the long-term health of their members and choose products that are healthy and sustainably grown, and nonprofit hospitals may be more willing to admit patients that do not have health insurance or need long-term care. Cooperatives and nonprofits may also be less likely to engage in risky behavior, making them more sustainable in economic downturns, thus creating a more reliable cooperative economy.
While more research should be done on the longterm consequences of cooperative and nonprofit forms of corporate governance, based on the example of credit unions during the subprime mortgage crisis, it is likely that the effects are significant, widespread and meaningful.
Jordan van Rijn is Senior Economist for the Credit Union National Association (CUNA) and has nearly 10 years of experience in economic development, microfinance and economic research in Latin America, Africa, Southeast Asia and the U.S. He conducts statistical and economic analysis that supports CUNA’s advocacy efforts.